ForgeLab & Methodology
Overview
ForgeLab is TokForge's integrated benchmarking and optimization system. It helps you systematically measure and optimize model performance on your device:
- Benchmark: Run standardized speed tests on any model configuration
- AutoForge: Automatically sweep configuration parameters across four optimization tiers (Instant, Short, Medium, Long)
- Profiles: Save best-performing configs and apply them instantly
- Matrix: Compare results across devices, models, and backends
- Sharing: Export benchmark cards and JSON profiles for fleet analysis
Every benchmark result is stored with its complete configuration, making all performance measurements reproducible and comparable across devices.
ForgeLab UI
The Forge screen is a three-tab interface for benchmarking and optimization:
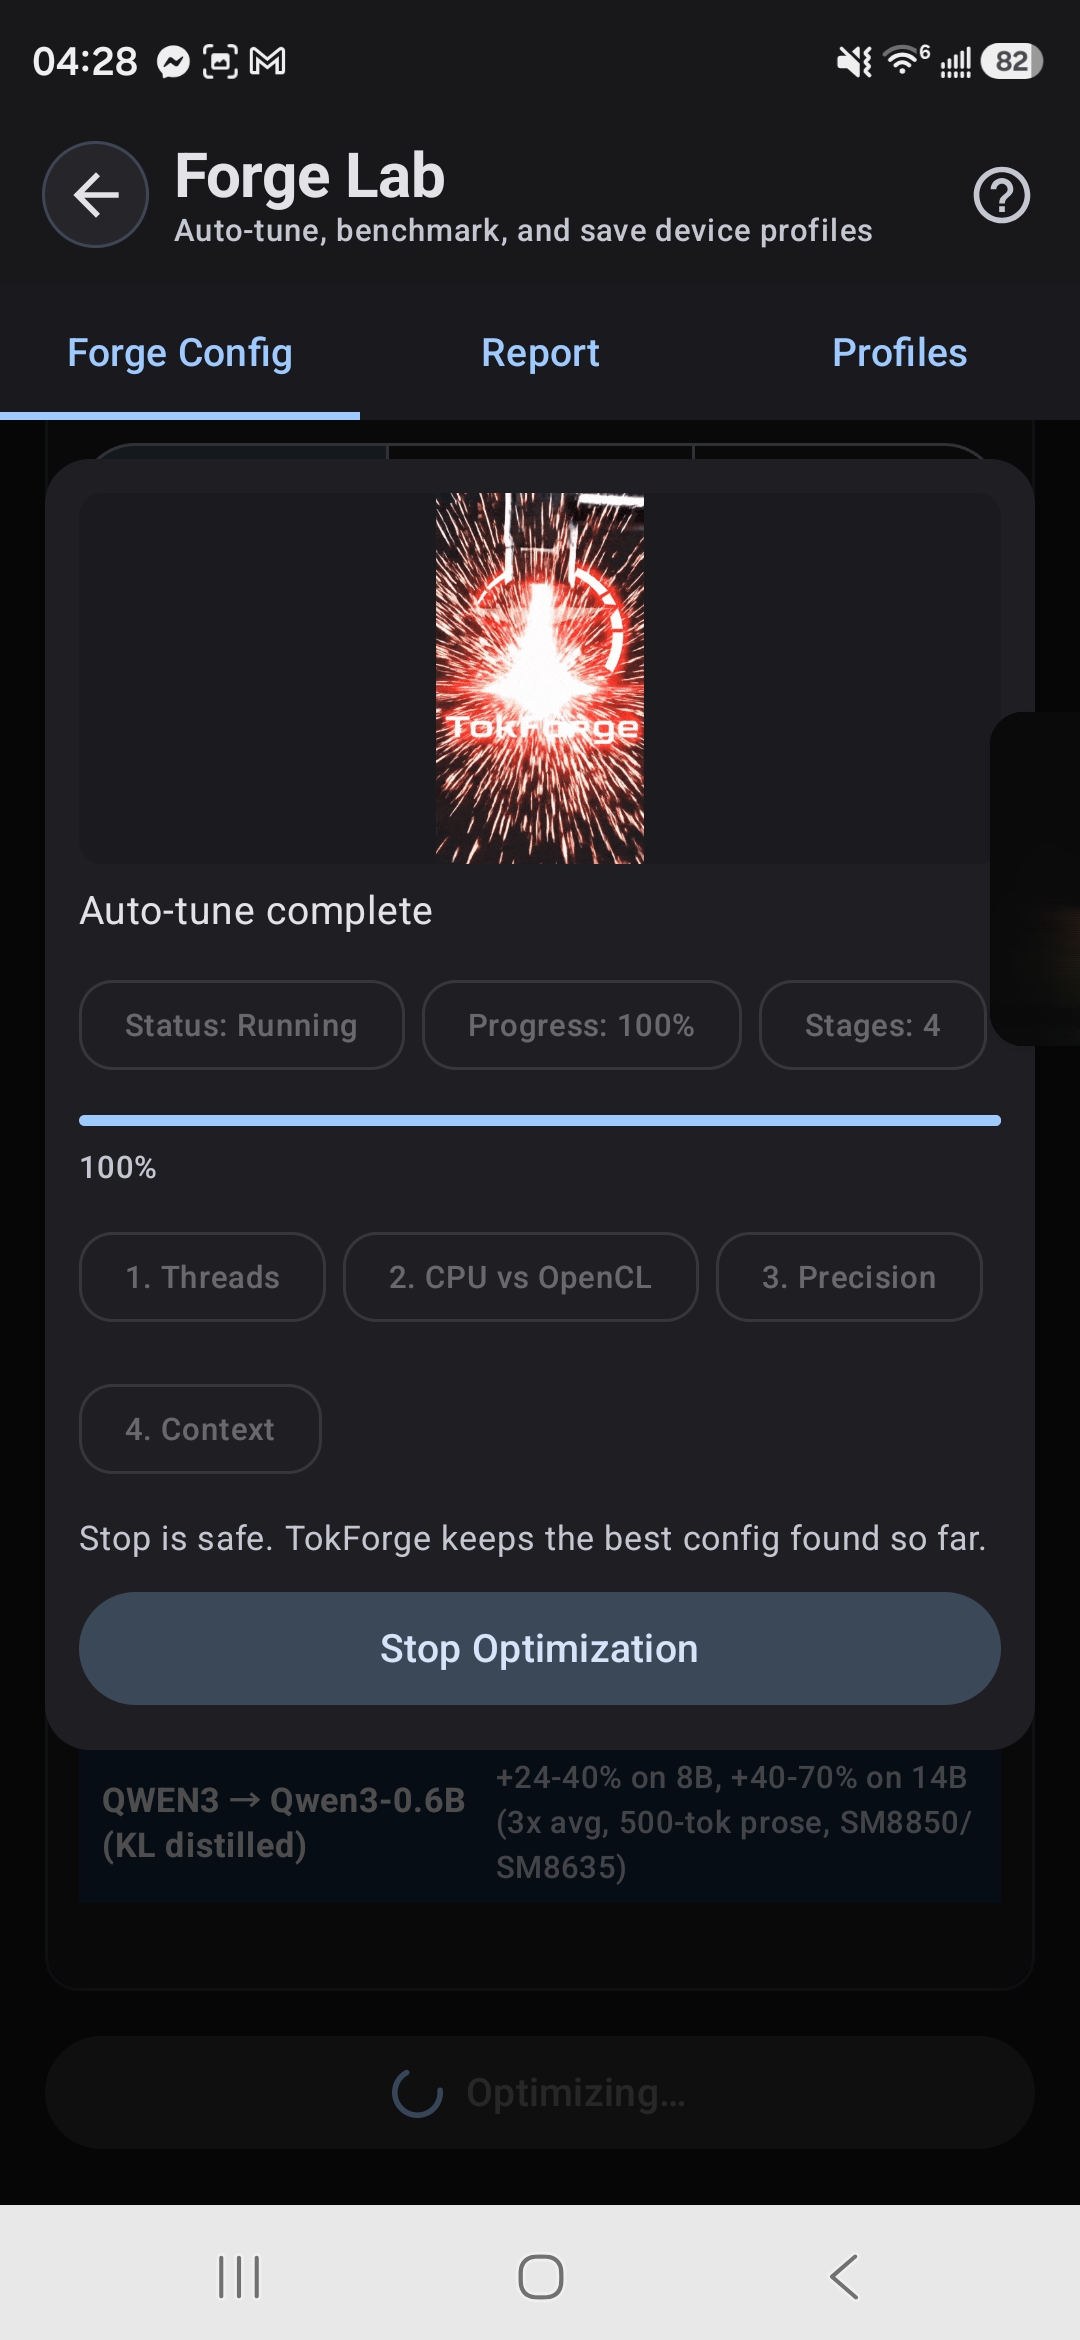
Tab 1: Config (Optimization Control)
Purpose: Configure and run AutoForge optimization sweeps.
What you can do:
- Select a model to optimize
- Choose a backend (MNN, GGUF, or Remote API)
- Pick an optimization tier (Instant, Short, Medium, or Long)
- Start the AutoForge sweep with a single tap
- Watch real-time progress showing which parameters are being tested
- See the best result found so far and estimated completion time
- View measured speculative decode speedup for tested model pairs
Typical workflow: Select your loaded model → Pick "Medium" tier → Watch as TokForge tests different thread counts, KV cache types, batch sizes, and spec decode configurations → Get the optimal config in less than 15 minutes
Tab 2: Report (Results & History)
Purpose: View benchmark results and historical performance data.
What you can see:
- Benchmark Card: Latest result with headline tok/s, prefill latency, model/device info, and spec decode uplift (if applicable)
- Benchmark History: Scrollable list of past runs with timestamps, backends, and performance metrics
- Manual Run: Run a single benchmark with custom prompt and token limits
- Export/Import: Share benchmarks as JSON or import results from other devices
The benchmark card shows your inference speed at a glance. Tap it to see full details like prefill time, delta prefill latency, total latency, spec decode results, and the exact configuration used. Share results via WhatsApp, Telegram, or email with a single button tap.
Tab 3: Profiles (Configuration Management)
Purpose: Manage saved configurations and apply them to inference.
What you can do:
- View all saved profiles with their best tok/s scores
- See where each profile came from (manual benchmark, auto-tune, or imported)
- Apply a profile instantly to switch your inference config
- View the full parameter list of any profile
- Export a profile as JSON for sharing or backup
- Import profiles from files or paste JSON directly
Profiles are named by device SoC, model, and backend. When you apply a profile, TokForge loads those exact settings and returns you to chat with the new configuration active. No manual config editing needed.
Optimization Tiers
AutoForge offers four time-based optimization tiers. Each tier automatically sweeps different parameter combinations to find the best configuration for your hardware and model:
Instant Tier
Use case: Quick baseline check or validate a config change works.
- What it tests: Single config (your current settings as baseline)
- Parameters swept: None, applies defaults without sweep
- Output: Baseline tok/s number to compare future runs against
Fast Tier (<1 minute)
Use case: Quick sweep to find obvious wins in threading.
- MNN: Tests backend configuration only
- GGUF: Tests thread configurations
- Output: Fast baseline optimization, 2-5% uplift
- Time: Less than 1 minute
Medium Tier (<15 minutes)
Use case: Production optimization that covers most parameter interactions.
- MNN: Sweeps thread counts, backend, context length, and spec decode configurations
- GGUF: Sweeps thread counts, batch_threads, KV cache types, flash attention, context length, and spec decode (plus GPU backend if Vulkan is available)
- Output: Comprehensive optimal config with 5-15% uplift over baseline
- Time: Less than 15 minutes
Long Tier (~30 minutes)
Use case: Exhaustive testing for scientific validation or fleet-wide optimization.
- MNN: All Medium parameters plus precision modes (int8, fp32)
- GGUF: All Medium parameters plus batch_size optimization
- Output: Complete performance landscape and detailed parameter sensitivity analysis
- Time: Approximately 30 minutes
How Benchmarks Run
Warmup & Measured Runs
Every benchmark follows a standardized structure to ensure reproducible results:
- Warmup run (1 run): Primes CPU caches, GPU memory, and JIT compilation. Results are discarded.
- Measured runs (3 runs): Actual performance measurements. The median value is selected to reduce variance from outliers.
Metrics collected per run: Prefill latency (ms), decode latency (ms), tokens per second (tok/s), and token count.
Single Benchmark
A manual benchmark run sends a prompt to your loaded model and measures inference speed. You can customize:
- Prompt: Any text input (default: standardized benchmark prompt)
- Max tokens: Length of generated response (default: 128)
- Number of runs: Averaging (default: 3 measured runs)
Auto-Matrix
The auto-matrix feature benchmarks all combinations of installed models and available backends in one async operation. This produces a complete device performance matrix, useful for understanding which model/backend combination is fastest on your hardware.
TokForge Score & Metrics
TokForge Score: A composite metric computed as decode_tok/s × 0.7 + prefill_tok/s × 0.3. This weighted formula prioritizes decode speed (70%) while accounting for prefill latency (30%), reflecting real-world inference where generation throughput dominates user perception.
| Metric | Description | Unit |
|---|---|---|
| tok/s | End-to-end tokens per second (prompt + decode) | tokens/sec |
| Decode tok/s | Decode-only throughput (excludes prefill) | tokens/sec |
| Prefill tok/s | Prompt processing throughput | tokens/sec |
| Prefill latency | Time to process the input prompt before generating | milliseconds |
| Delta prefill | Latency for new messages only in multi-turn conversations (excludes cached context) | milliseconds |
| Decode latency | Total time spent generating output tokens | milliseconds |
| Token count | Number of tokens generated in the run | count |
Speculative Decoding Optimization
ForgeLab optimizes speculative decoding (spec decode) performance by systematically testing draft model configurations. The system generates optimized configs by testing different draft model backends and prediction lengths on CPU while the target model runs on GPU.
Spec Decode Sweep Configuration:
- Fast tier: CPU backend with prediction length 2
- Medium & Long tiers: CPU backend with prediction lengths 2, 3, and 4
- Target-backend pairing: Draft model runs on CPU to avoid contention; target model runs on available GPU
- Uplift measurement: Records the measured speedup percentage compared to target-only inference
Config profiles with spec decode: When an optimization tier tests spec decode, the resulting profile includes optimal draft backend, prediction length, draft thread count, and measured uplift percentage. Apply a profile to activate both the base inference configuration and its paired spec decode settings.
Typical workflow: Run a Medium or Long tier optimization, which automatically tests spec decode variants. Check results to see measured uplift percentages for each configuration. Apply a high-uplift profile to activate spec decode for your inference.
Hardware Profiling & Thermal Management
Before benchmarking, TokForge auto-detects your device's hardware profile:
- SoC model: Snapdragon 8 Elite, MediaTek Dimensity 9400+, etc.
- CPU topology: Performance cores vs efficiency cores, maximum frequency
- GPU architecture & Vulkan support: Adreno, Mali, or other GPU with Vulkan capability detection for MNN Vulkan and GGUF Vulkan CoopMat
- RAM: Total available memory for model loading
- Android version & GPU renderer: Stored for reproducibility
This hardware profile informs recommended starting configurations and sets upper bounds for thread counts and context sizes. It also determines which GPU paths (CPU, OpenCL, Vulkan MNN, Vulkan GGUF CoopMat, QNN) are available and which parameters are swept during optimization.
Thermal Management: AutoTuneThermalGate continuously monitors device temperature during optimization. When temperature thresholds are exceeded (moderate → severe → critical → emergency), the system automatically pauses benchmarking and waits for the device to cool before continuing. Thermal status and battery level are recorded with each benchmark result for context about measurement conditions.
Backend Comparison
ForgeLab tests across five GPU paths for comprehensive device coverage:
- CPU: Multi-threaded CPU inference
- OpenCL: Adreno and Mali GPU acceleration via OpenCL
- Vulkan MNN: MNN backend with Vulkan GPU (custom kernels, 15.3 tok/s on 8B)
- Vulkan GGUF CoopMat: GGUF backend with ggml-vulkan cooperative matrix (16.85 tok/s on 3B)
- QNN (experimental): Qualcomm Snapdragon processor optimizations
| Aspect | MNN | GGUF (llama.cpp) |
|---|---|---|
| Speed | 2-8x faster on mobile | Baseline (reference) |
| Format | .mnn directory | Single .gguf file |
| Quantization | 4-bit (Q4_0, Q4_1) | Q4_K_M through Q8_0 |
| GPU acceleration | OpenCL (Adreno/Mali) + Vulkan | Vulkan (where available) + GPU layers |
| Vulkan support | MNN Vulkan with custom kernels | GGUF Vulkan CoopMat auto-tuned in Medium/Long tiers |
| Thinking models | Not yet supported | Full support |
| Model coverage | Qwen3 primarily | Broader ecosystem |
Configuration Profiles
A configuration profile is a complete set of inference settings saved per (SoC, model, backend, quantization) tuple. Profiles capture:
- Thread counts and batch parallelism settings
- Context length and batch_threads (GGUF)
- KV cache type (f16, q8_0, q4_0; memory vs. speed tradeoff)
- Precision mode / MNN backend selection (low = int8, normal = fp32)
- Flash attention (on/off for GGUF)
- GPU layer allocation (for MNN and GGUF Vulkan)
- Spec decode settings: optimal draft backend, prediction length, draft threads, and measured uplift percentage
Profile sources: Profiles are tagged by how they were created. Manual benchmarks create "benchmark" source profiles (highest priority). AutoForge creates "auto-tune" profiles. Device auto-detection creates "auto_profile" (lowest priority). Profiles from other devices are tagged "imported". This hierarchy ensures manually-tuned configs are never overwritten by automatic sweeps.
Applying a profile: When you tap Apply on a profile, TokForge loads those exact settings, switches backends if needed, unloads the current model, and reloads it with the new configuration. You return to chat automatically with the profile active.
Benchmark Matrix & Auto-Matrix
Benchmark Matrix: All results organize into a cross-model × cross-backend comparison grid by SoC × Model × Backend for easy comparison:
- See which device performs best with each model
- Compare MNN vs GGUF performance side-by-side
- Identify which models are well-optimized on your hardware
- View all saved configuration profiles linked to each result
Auto-Matrix: Run a comprehensive automated sweep across all loaded models and available backends in a single operation. Auto-Matrix benchmarks produce a complete device performance matrix useful for understanding which model/backend combination is fastest on your hardware.
Export/Import: Benchmark results and configuration profiles are exportable as JSON for cross-device sharing and fleet analysis. Deduplication ensures imported results don't create duplicates if the exact same configuration was already benchmarked locally.
Benchmark Cards & Sharing
Each benchmark result generates a card via BenchmarkCardRenderer showing key metrics: headline tok/s, decode tok/s, prefill latency, total runtime, model name, device SoC, and thermal data. For speculative decoding configurations, cards display the measured uplift percentage.
Sharing options:
- Text share: Copy to clipboard or send via WhatsApp, Telegram, Signal, Email, Discord, Slack
- JSON export/import: Export benchmark results and configuration profiles as JSON for cross-device sharing and fleet analysis
- PNG export: Share benchmark cards with device info, thermal data, and TokForge branding
Imported benchmarks are merged into your local database and appear in your benchmark history. You can compare your device's results directly against results from colleagues running the same models.
Key Findings
- MNN consistently outperforms GGUF on mobile SoCs, often by 2-8x. Inference is typically memory-bandwidth bound on ARM, and MNN's mobile-optimized kernels reduce overhead.
- Speculative decoding can be slower on mobile due to draft model overhead and bandwidth contention between main and draft models.
- Thread count matters: Performance cores only (not efficiency cores) should be used for inference threads. AutoForge detects the optimal split.
- Flash attention provides measurable speedups on devices with sufficient memory bandwidth (16GB+ RAM recommended).
- Short and Medium tiers capture most optimization gains for typical use cases. Long tier is valuable for scientific validation or fleet-wide baseline establishment.
Reproducibility & Benchmark Entity
Every benchmark result is stored with its complete configuration profile and runtime fingerprint. This means any result can be reproduced on identical hardware by loading the same profile. Each benchmark entity records:
- Device fingerprint: SoC, CPU cores, GPU, RAM, Android version, and GPU renderer
- Model info: Model name, quantization, parameter count
- Full configuration used: Backend type (MNN / GGUF / Remote), thread counts, batch size, context length, KV cache type, precision mode, flash attention, spec decode settings
- Results: tok/s, decode tok/s, prefill tok/s, prefill latency, decode latency, total timing
- Environment: Battery percent, thermal status, available heap memory at test time
- Metadata: Timestamp, benchmark tier used, spec decode uplift if applicable
Results that show unusual performance (e.g., heavy throttling) are tagged with thermal and battery data so you can identify when a device was under stress. Cross-device comparisons use exact runtime fingerprint matching to ensure accurate performance attribution.
API Access
All ForgeLab functionality is available programmatically via the MetricsService API with 90+ endpoints. See the API documentation for complete details. Sample endpoints include:
POST /control/auto-tune: Start an AutoForge sweep with a specified tierGET /control/auto-tune/status: Check progress of running optimizationPOST /benchmark/run: Run a single benchmark with custom prompt and token limitsGET /benchmark/results: Query stored benchmark results with filteringGET /benchmark/matrix: Get SoC × Model × Backend comparison matrixPOST /benchmark/auto-matrix: Run comprehensive cross-model benchmarkGET /benchmark/optimal-config: Get the best profile for a device/model/backend comboGET /benchmark/export: Export all results and profiles as JSONPOST /benchmark/import: Import results and profiles from another deviceGET /profiles: List all saved configuration profilesPOST /profiles/apply: Activate a saved profile for inference
Benchmark tips: Rotating tips are displayed during optimization waits to help guide users through longer sweeps.